Description
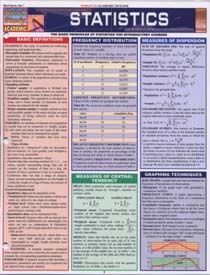
All those scary formulas, graphing techniques, terminology, and more. Nifty charts for calculating normal curve areas, critical values of f, and critical values of t. Boxes with explanations of all the main ideas (e.g., biased and unbiased estimators and chi-square tests) taught in a typical statistics course. Perfect for AP students when their brains start exploding.

Reviews
There are no reviews yet.